
Page 20 - Future Demands Jan 2021
P. 20
It’s this three stage process of data gathering, data analysis, and insight that allows for more informed decision making.
To demonstrate, let’s take a look at a real-world example. In this case, the impact of the pandemic on our property industry, and how this can help us predict future trends.
Phase One – Gather the Data
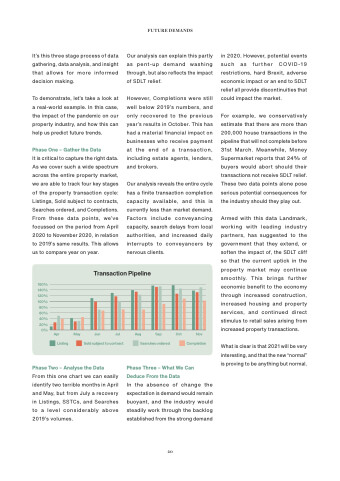
It is critical to capture the right data. As we cover such a wide spectrum across the entire property market, we are able to track four key stages of the property transaction cycle: Listings, Sold subject to contracts, Searches ordered, and Completions. From these data points, we’ve focussed on the period from April 2020 to November 2020, in relation to 2019’s same results. This allows us to compare year on year.
Our analysis can explain this partly as pent-up demand washing through, but also reflects the impact of SDLT relief.
However, Completions were still well below 2019’s numbers, and only recovered to the previous year’s results in October. This has had a material financial impact on businesses who receive payment at the end of a transaction, including estate agents, lenders, and brokers.
Our analysis reveals the entire cycle has a finite transaction completion capacity available, and this is currently less than market demand. Factors include conveyancing capacity, search delays from local authorities, and increased daily interrupts to conveyancers by nervous clients.
in 2020. However, potential events such as further COVID-19 restrictions, hard Brexit, adverse economic impact or an end to SDLT relief all provide discontinuities that could impact the market.
For example, we conservatively estimate that there are more than 200,000 house transactions in the pipeline that will not complete before 31st March. Meanwhile, Money Supermarket reports that 24% of buyers would abort should their transactions not receive SDLT relief. These two data points alone pose serious potential consequences for the industry should they play out.
Armed with this data Landmark, working with leading industry partners, has suggested to the government that they extend, or soften the impact of, the SDLT cliff so that the current uptick in the property market may continue smoothly. This brings further economic benefit to the economy through increased construction, increased housing and property services, and continued direct stimulus to retail sales arising from increased property transactions.
What is clear is that 2021 will be very interesting, and that the new “normal” is proving to be anything but normal.
160% 140% 120% 100%
80% 60% 40% 20%
0% Apr Listing
May Jun
Sold subject to contract
Aug
Searches ordered
Oct Nov Completion
FUTURE DEMANDS
Transaction Pipeline
Phase Two – Analyse the Data
From this one chart we can easily identify two terrible months in April and May, but from July a recovery in Listings, SSTCs, and Searches to a level considerably above 2019’s volumes.
Phase Three – What We Can Deduce From the Data
In the absence of change the expectation is demand would remain buoyant, and the industry would steadily work through the backlog established from the strong demand
Jul
Sep
20
